
t
John Lewis PLC announced its unaudited interim results on 15 September 2022 for the 26 weeks ended 30 July 2022. The company reported a loss before tax of £99m, or £92m before exceptional costs. During this period, John Lewis sales increased 3% like-for-like to £2.1bn, while Waitrose sales decreased 5% like-for-like to £3.6bn.
| Date | 15 Sept 2022 |
| Time | 07:45:01 |
| Category | Results |
| ID | 5344Z |

These results are for John Lewis plc only and do not represent the results for John Lewis Partnership plc which can be found on the John Lewis Partnership website or at www.johnlewispartnership.co.uk/financials.html
JOHN LEWIS PLC UNAUDITED INTERIM RESULTS FOR THE 26 WEEKS ENDED 30 JULY 2022
15 September 2022
RESULTS SUMMARY
● Our business resilience and employee-owned model means we can prioritise support for our Partners, customers, communities and suppliers during unprecedented cost of living crisis.
● First half loss[1] of £99m, or £92m before exceptional costs, largely due to the combination of cost inflation not fully passed on to customers, impact of cost of living crisis, unwinding of Covid shopping patterns and investments to support Partners, customers and suppliers.
● Announcing a one-off cost of living support payment - £500 for full-time Partners, less for part-time; increasing lowest rates of pay for Partners; free food over the winter and doubling our financial assistance fund to help with bills; committed £16m to Britain's pig farmers; £2m support and 2.8 million meals to vulnerable communities.
● Doubling down on Partnership Plan with investments in John Lewis and Waitrose with customer numbers up and a strong focus on value. Sales[2] up in John Lewis by 3% like-for-like[3] to £2.1bn; down in Waitrose by 5% like-for-like to £3.6bn.
● Cost savings of £90m in the half; expanding 'Lean Simple Fast' efficiency programme (part of the Partnership Plan) to improve margins and productivity given inflationary headwinds.
● Progress on diversification - new and relaunched financial products and plans to build rental homes taking shape.
● Strong balance sheet with £1.5bn of cash and credit facilities to help weather further shocks.
● Outlook for the rest of the year is highly uncertain owing to the cost of living crisis and its impact on discretionary spending as well as criticality of our Christmas trading period.
Dear Partners,
This is an incredibly sad time for our country. The death of Her Majesty The Queen - who for 70 years has been a constant figure in the nation's life - is profoundly upsetting. Our thoughts are with King Charles III and The Royal Family at this time.
Today, the Group is reporting its half year results. I said at our end of year results in March that the outlook for this year was uncertain: war had just broken out in Ukraine and inflation was elevated and looked to be persistent.
No one could have predicted the scale of the cost of living crisis that has materialised, with energy prices and inflation rising ahead of anyone's expectations. As a business, we have faced unprecedented cost inflation across grocery and general merchandise.
I know Partners throughout the business are really feeling it, after two tough years of the pandemic and necessary - but difficult - restructuring. My great thanks to everyone for your continuing commitment in these times of uncertainty. I know it has not been easy.
We are responding to the cost of living crisis by supporting those who need it and by stepping up our efficiency programme. We are forgoing profit by making choices based on the sort of business we are, led by our Purpose - 'Working in Partnership for a happier world' - by helping our Partners, customers, communities and suppliers.
Performance
This half year we made a loss before tax and exceptional items of £92m, compared to a profit of £69m in the same period last year and a loss of £52m three years prior (i.e. the last pre-Covid half). This is before exceptional items, principally reducing the size of our London office space. Including exceptional items, we made a loss before tax of £99m (loss before tax of £29m in 2021/22 and a profit before tax of £192m in 2019/20, which included the benefit of closing the defined benefit pension scheme).
It is not unusual for us to make a loss in the first half of the year - we have done so in three of the last four half years. Our trading is heavily skewed to Christmas with most of our profits coming in the last quarter of the year.
The loss was largely due to two main factors:
● Inflation has affected consumer spending. We have more customers year-on-year in both brands (up 6% in Waitrose and 4% in John Lewis) but they are spending less. Inflation has increased our costs, which means we have to do more to meet our original efficiency targets because we have not passed on all of the increased costs to our customers;
● Post-pandemic customer trends. We have seen in-store spending rebound compared to last year. Online remains elevated compared to pre-pandemic levels; we believe this shift is permanent. We have seen customers move their discretionary spending from high margin, big ticket household items to restaurants and holidays - from dining room furniture to dining out.
Waitrose
Waitrose sales were £3.6bn, down 5% like-for-like on a year ago (down 5% in total); up 7% on a like-for-like basis on three years ago (up 4% in total). During the pandemic, Waitrose benefited from bigger baskets as customers were restricted by the pandemic, dining out less and doing fewer shops.
Customer numbers have held up, transactions were up 14% year-on-year, but basket sizes are smaller by nearly a fifth. Online shopping continues to be important, accounting for 15% of sales; significantly up on before the pandemic and 5% below the pandemic peak of around 20%. Nearly seven in ten baskets include a product from the Essential range. Total customer numbers are 13.4 million, up 6% year-on-year.
Waitrose Trading operating profit fell by £93m to £432m due to a combination of volume decline and inflationary pressures being partially offset by a more favourable profit mix and cost savings.
John Lewis
John Lewis sales were £2.1bn, up 3% like-for-like on last year (up 3% in total). Against three years ago, John Lewis sales were up 13% like-for-like (up 4% in total). This has been driven by a return to shops. The share of sales in shops has averaged 41% for the half year, compared to 26% last half year, during the pandemic, and 60% before Covid. City Centre stores have come back most strongly with the return to more office working.
Fashion has been the best performing category, growing 25% compared to last year with strong performance in holiday wear, as people returned to travel and summer breaks. Conversely, our home and technology categories, which performed strongly during the pandemic, declined year-on-year.
The impact of the cost of living - and specifically growing concerns about inflation and energy costs - is evident in patterns of spending. ANYDAY - our great value own-brand - saw sales rise 28% on last half year. Energy saving items also attracted high demand - air fryers up 56%; smart thermostats up 8%. Customer numbers have been strong, with half a million more people shopping with John Lewis than a year ago. Total customer numbers are 12.2 million, up 4% year-on-year.
John Lewis Trading operating profit has been maintained at £295m compared to last year.
Response to the cost of living crisis
Partners: We are the lifeblood of the business - not just employees but owners. We have doubled (to £800,000) financial assistance for Partners facing hardship. We are making an active choice to spend £45m to help our Partners, in addition to the April 2022 pay increase and Bonus:
● We will provide free food at work for 14 weeks over winter;
● In response to Partners' opinion and the direct influence of our Partnership Council, especially its Partner Committee, we are making a one-off cost of living payment to Partners equal to £500 per full-time Partner (pro-rated for part-time Partners);
● We are increasing the entry level pay for Partners by 4%, costing £10m in the second half.
Customers: We have been extremely considered about how and where we pass on cost inflation to our customers. For example, over 95% of school uniform items have had a price freeze or reduction this year, conscious that these are an essential item. In John Lewis, following the retirement of 'Never Knowingly Undersold', we are investing £500m into prices during the financial year. We improved point of sale credit for big ticket items and are testing a new loans product through our financial services arm. Customers benefited from £46m in money-off vouchers through the MyWaitrose loyalty scheme and we have just refreshed our My John Lewis loyalty programme. Customers continue to have great opportunities to shop value through Essential Waitrose and ANYDAY ranges.
Suppliers: We took the decision to invest £16m in British pig farmers to ensure not just their survival but their ability to continue to meet high animal welfare standards.
Communities: In the half we donated more than £2m to charities to help families through challenging times, and provided the equivalent of 2.8 million meals through FareShare.
Partnership Plan - Year 2
We continue to deliver our five-year Partnership Plan, which we're adapting to contend with the cost of living crisis. For example, we are expanding our existing efficiency programme - known as Lean Simple Fast. Our immediate focus is on simplifying business processes, making products easier to return to get products back on sale quicker and improving the way stock moves round the business. We were originally targeting a cost reduction of £300m by year 2 of the Plan, this financial year. We are forecasting to achieve this and intend to exceed it significantly over the life of the Plan. Savings in this first half year were £90m.
We are also significantly investing in our brands:
● John Lewis relaunched earlier this month for 'All Life's Moments' alongside a complete refresh of our main John Lewis & Partners mid-tier brand;
● Waitrose relaunches soon with an even sharper focus on quality, service and sustainability;
● The rollout of the John Lewis 'shop within a Waitrose shop' continues - expanding from 49 currently to 88 stores by the end of the year;
● The trial of a new concept John Lewis format launches early in 2023;
● Our new partnership with Dobbies and an expanded partnership with Deliveroo are taking Waitrose to new customers;
● We are making good progress with our plans to diversify the business. In financial services, we are trialling a new loan product and relaunched our pet insurance product. Plans to develop rental homes ('build to rent') are taking shape.
Outlook
The outlook is uniquely uncertain. We believe we are well placed to navigate the current inflationary headwinds. First, we have a strong balance sheet, which helps us navigate through trading volatility with total liquidity at £1.5bn (cash of £1.1bn and facilities of £0.4bn). Second, the loyalty of our customers and a deep understanding of their changing habits and needs. Third, the dedication of our Partners who provide great service for our customers.
A successful Christmas is key for the business given the first half. We will need a substantial strengthening of performance, beyond what we usually achieve in the second half, to generate sufficient profit to share a Partnership Bonus with Partners. Much will depend on the wider economic outlook and consumer sentiment.
For our part, we want to give our customers a memorable and affordable Christmas, with Christmas markets in 13 John Lewis stores and 60 new Waitrose products.
Time and again we have been tested as a Group. We have always come through - and stronger - by being mindful of the challenges but also open to new opportunities. We will do so again.
Sharon White
Partner and Chairman
Notes
A glossary of financial and non-financial terms is included at the end of this document.
Group performance
This half year we made a loss before tax and exceptional items of £92m, compared to a profit of £69m in the same period last year and a loss of £52m three years prior (i.e. the last pre-Covid half). This is before exceptional items, principally reducing the size of our London office space. Including exceptional items, we made a loss before tax of £99m (loss before tax of £29m in 2021/22 and a profit before tax of £192m in 2019/20, which included the benefit of closing the defined benefit pension scheme).
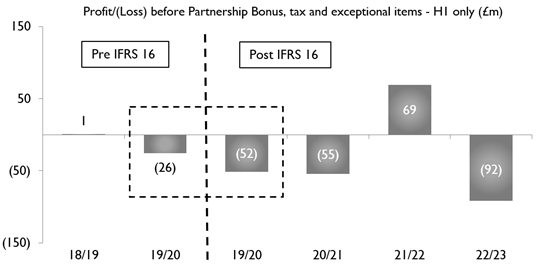
Note: The chart shows our (loss)/profit before Partnership Bonus, tax and exceptional items since 2018/19. The 2019/20 year is presented twice as that is the year we adopted IFRS 16 (lease accounting standard) which reduced our profits that half year by £26m. All subsequent periods are post adoption of IFRS 16
|
|
|
Waitrose |
|
John Lewis |
||||||||
|
|
|
Jul 22 |
Jul 21 |
Jul 19 |
% vs |
% vs |
|
Jul 22 |
Jul 21 |
Jul 19 |
% vs Jul 21 |
% vs Jul 19* |
|
Total trading sales (£m) |
|
3,584 |
3,792 |
3,446 |
(5)% |
4% |
|
2,136 |
2,082 |
2,059 |
3% |
4% |
|
Total trading sales LFL (£m)** |
|
3,584 |
3,792 |
3,345 |
(5)% |
7% |
|
2,129 |
2,071 |
1,876 |
3% |
13% |
|
Revenue (£m) |
|
3,311 |
3,515 |
3,176 |
(6)% |
4% |
|
1,637 |
1,638 |
1,613 |
0% |
1% |
|
Trading operating profit (£m) |
|
432 |
525 |
530 |
(18)% |
(18)% |
|
295 |
295 |
285 |
0% |
4% |
|
Trading operating profit (%) |
|
12% |
14% |
15% |
|
|
|
14% |
14% |
14% |
|
|
* As a consequence of the distortions to trade and our cost base over the last two years, we continue to compare our first half result to the most recent pre-Covid half year in 2019/20
** Our LFL definition is outlined in the Glossary section
Waitrose performance
Waitrose sales fell 5% on a like-for-like basis (down 5% in total) but were up 7% like-for-like compared to three years ago (up 4% in total).
We had an exceptional first half last year, strongly outperforming the market as we continued to serve more customers especially online during the pandemic. As customers have returned to pre-pandemic shopping patterns - shopping around, convenience, eating out more and taking holidays - so our outperformance has naturally reversed: our market share has fallen from 5.0% to 4.7%[4].
Waitrose Trading operating profit fell by £93m to £432m largely due to:
● Volume decline of 10%, driven largely by the shift in customer behaviour mentioned above as well as some availability shortages in the half;
● Partially offsetting this we saw a rebalancing of trade, with more customers returning to shops, which drove a more favourable profit mix. The introduction of online delivery charging in Q3 last year improved profitability in online;
● Inflation pressures across the Waitrose cost base, including pay, supply chain costs and product costs. We've experienced extreme levels of inflation in the price we have to pay for our products. Despite a lot of hard work from the commercial teams and from our suppliers, average cost price inflation through the first half was +4%, but had reached +8% as we ended the half and has since continued to rise. Tackling costs on behalf of our customers is a priority for the foreseeable future;
● Offsetting these pressures, we delivered £25m of cost savings within Waitrose Trading operating profit, principally driven by long-term work to improve the efficiency of our sourcing and the initial benefits of restructuring of management teams across our shops. In addition we saw lower direct costs of Covid in the half.
A significant factor in our year-on-year volume decline has come from normalisation in the online channel, with participation of total sales dropping back to 15% from 18% last year. Where we were able to disproportionately grow online during the pandemic, annualising that, our performance was always going to skew the numbers this half. Online demand has now stabilised at three times pre-pandemic levels.
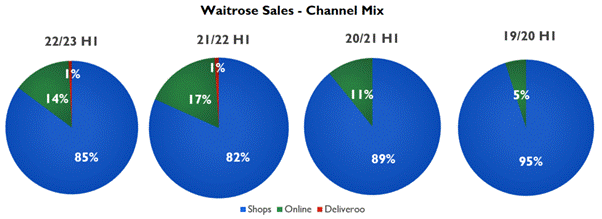
The cost of living crisis together with the aftermath of lockdown restrictions is changing shopping habits. Customers continue to choose Waitrose for quality, value, ethics and service but more frequently they are shopping between our value, mid-tier and premium ranges to manage tighter budgets. In addition, despite total transactions (in-store and online) increasing by 14% year-on-year, we saw a step down in basket sizes with an 18% reduction in the average basket value.
The success of our 1,000 strong Essential Waitrose range shows how cheaper choices don't have to mean low quality. In the first half, nearly seven in ten customers had an Essential range item in their basket. The relaunch of the MyWaitrose loyalty scheme is further helping customers cut costs on the products they buy most often.
In-store and online convenience top-up shopping is growing; Waitrose has 57 convenience stores across the UK and a successful partnership with Deliveroo, which is now in 220 sites. In the first half, we announced the launch of our partnership with Dobbies garden centres, with two foodhalls opened to date and a further 48 planned within the next 18 months. Our extension into more convenient market segments, together with supplier partnerships, will help us reach new customers.
Building on the combined strength of our two brands, we continued the roll out of John Lewis 'shop in shops' to a further 11 Waitrose stores in the first half of the year, taking the total to 49 and plans to reach 88 by year end. Almost all general merchandise in Waitrose stores is now from John Lewis providing greater operating synergies and exposure for our brands to more customers.
Our focus on innovation saw the launch of nearly 300 new products this year. We won the Grocer Gold Award for service, Grocer Gold Awards 2022: own-label range of the year for the Levantine Table and picked up nine Grocer 33 wins in the first half of the year.
John Lewis performance
John Lewis sales grew by 3% like-for-like on last year (up 3% in total) and up 13% like-for-like compared to three years ago (up 4% in total).
John Lewis Trading operating profit at £295m was flat on last year. Key factors within this result include:
● Strong sales, with customers able to shop in our stores for the full half, following national lockdown which saw our shops closed for part of last year. Customers were able to take advantage of our great service, inspiration and personal advice;
● We delivered £22m of cost savings within John Lewis Trading operating profit as part of our plan to become a leaner, simpler, faster business. In addition we saw lower direct costs of Covid in the half;
● These improvements in performance were offset by inflation across the John Lewis cost base, including pay, product costs and freight. For own-brand products, higher costs directly impacted margin, with not all cost increases passed onto customers.
During the half, we announced £500m of investment in quality and value and retired our Never Knowingly Undersold price policy, which had become increasingly obsolete. The move enables John Lewis to take the lead on value, rather than just responding to other retailers, an increasingly important lever as customers manage tighter budgets.
ANYDAY remains our most successful ever own-brand launch, designed for longevity and offering everyday style and great value. In the first half of the year, we expanded the range in swimwear, kidswear and new outdoor furniture. There are now over 2,000 ANYDAY products. Three million customers have shopped the range since its launch in April 2021, and it has helped attract over 800,000 new and reactivated customers.
Channel mix for the year was 59% online and 41% shops, compared to 74% and 26% for last half year. Since the removal of enforced lockdown related closures, we have seen a stabilisation of the online/shop mix at close to 60:40%. That compares to a pre-pandemic ratio of 40:60%, reflecting the longer term effects of the pandemic on customer behaviour and closure of 16 stores in the last two years.
We expect this shape of trade to continue, with our shops playing a critical role in driving both customer experience and excitement and supporting our online business, through giving our customers convenient Click & Collect, browsing and returns options.

Creating and investing in a more seamless virtual and in-store experience from store to John Lewis app to online, for example the launch of our 'in-store' mode in the John Lewis app, is bearing fruit. In the first half, the John Lewis app share of online revenue was over 26% compared to 22% last year. Visits to the John Lewis app are up 4% year-on-year; adopters are more loyal to the brand, typically spending an additional 15% in their first year.
In stores, we are better at showcasing new products and seasonal items and we have launched our new brand promise, For All Life's Moments, which encapsulates our commitment to always be there for our customers.
After two years of strong technology sales, driven largely by the effects of the pandemic shaping greater working from home and more time at home generally, we saw a deterioration in demand for technology this half. This was counterbalanced by a rise in the demand for fashion, as customers sought new season fashion in response to greater travel, leisure, socialising and customers returning to offices, post easing of the pandemic restrictions. Categories such as travel have seen year-on-year growth of +291%, swimwear +104% and sunglasses +24% as a consequence.

Financial Services performance
John Lewis Financial Services continues to grow. We have seen increased customer numbers, up 11% on last year, supported by a rebound in our foreign exchange business. We relaunched our pet insurance product, improved point of sale credit for big ticket items and are testing a new loans product. Across our savings offer, we have seen a growth in the number of customers using savings products, up by over 165%. Our transition of the Partnership Card has progressed well. We continue to see strong momentum of customers using our point of sale credit offer in John Lewis, with first half spending over £50m, up 46% compared to the first half last year.
Our focus in the second half is on continuing to grow this part of the business and on the relaunch of the Partnership Card.
Key Group profit movements vs last year
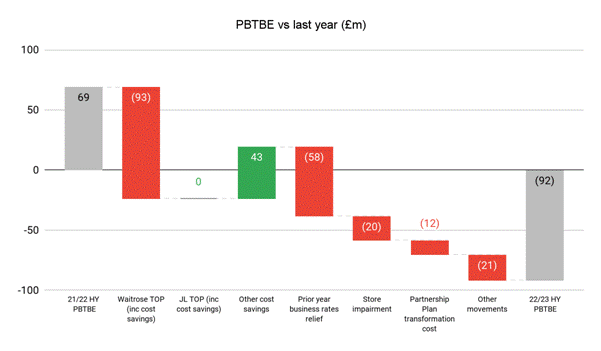 First half PBTBE is £161m lower than last year. This is primarily due to:
● Waitrose Trading operating profit declining by £93m. Key factors for this are outlined earlier in this section;
● John Lewis Trading operating profit was flat year-on-year. Key movements are outlined earlier in this section;
● Within the Waitrose and John Lewis Trading operating profit figures, cost savings of £47m were delivered. In addition, £43m of cost savings were achieved across other operating costs. In total, £90m of combined cost reduction was delivered in the half as part of our ongoing plans to become a leaner, simpler and faster business. This has been critical to help offset some of the exceptional inflationary pressures we have seen in the half;
● Government support was £58m lower as the business rates relief scheme ended in 2021. This was used to offset the impact of Covid on the Group, including trade disruption from closure restrictions and additional direct costs of £25m, costs which were absorbed in Trading operating profit in John Lewis and Waitrose last year;
● In the first half, we booked £20m of store impairment relating to higher discount rates in both grocery and general merchandise, and sales prospects in a handful of Waitrose shops where we do not believe post-pandemic trade will recover to previous levels;
● We continue to invest strongly in our Partnership Plan, incurring £12m higher operating cost this year related to the costs of change across our business;
● Of the £21m other movements, the largest contributor is a £10m recovery of overpaid taxes included as income in last year's first half performance.
Key profit movements vs 2019/20
As a consequence of the pandemic related distortions to trade and our cost base over the last two years, we continue to compare our first half result to the most recent pre-Covid half year in 2019/20.
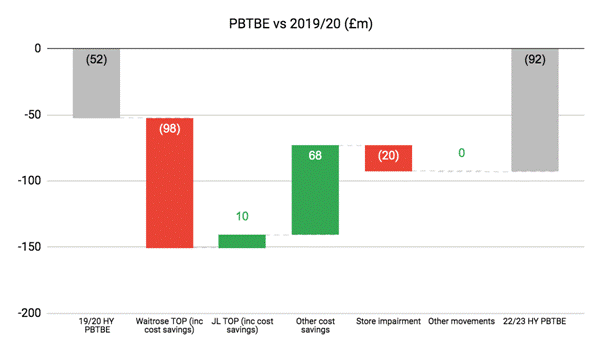
First half PBTBE is £40m lower than 2019/20, prior to the pandemic. This is primarily due to:
● Waitrose Trading operating profit declining by £98m. Despite sales growth of 4%, a key factor behind the decrease in profit is the shift to the lower profit online channel where mix of trade has increased from 5% to 15% over the period. In addition, within Waitrose Trading operating profit we delivered £55m of cost savings compared to 2019/20. These improvements were more than offset by inflation across pay, supply chain and shop operating costs;
● John Lewis Trading operating profit grew by £10m, despite the closure of 16 shops since the first half of 2019/20. Like-for-like sales have increased by 13% over the period, as customers have transitioned online. Cost savings of £33m compared to 2019/20 were offset by inflation across the cost base.
● In total, including cost savings reported within Waitrose and John Lewis Trading operating profit and across other operating costs, £156m of combined cost reduction was delivered in the half compared to the first half of 2019/20;
● In the first half, we booked £20m of store impairment relating to higher discount rates and a handful of Waitrose shops, where we do not believe post-pandemic trade will recover to previous levels. In 2019/20, there were no impairments reported in PBTBE at the half.
Delivering a leaner, simpler, faster Group
We are progressing with our ambitions to become a leaner, simpler, faster business. Our activity to drive profit improvement through a combination of margin improvement and cost reduction is well under way. Cost savings of £90m have supported the performance this half compared to last half. These have been driven by restructuring activity completed last year, as well as improving our cost of sales and property cost savings.
When the plan was launched, we were originally targeting a cost reduction of £300m by the end of this year and are on track to hit that target. We are not immune from the growing challenges presented by the inflationary environment in the UK, the cost of living crisis this is fuelling and the possibility of a UK recession. Faced with these dynamics, we are significantly increasing the speed and expanding the scope and size of our lean, simple and fast ambitions beyond our previous £300m target. This will be critical to growing and sustaining our profit in such an inflationary environment.
With this revised ambition in mind, we are currently mobilising work around four priority programmes, which include simplifying our shop processes and an end to end review of John Lewis returns processes.
Our total liquidity at the half year end remains strong at £1.5bn, including £1.1bn cash and short-term investments, and undrawn bank facilities of £420m. This is required to deliver the Partnership Plan and meet our obligations. Our Total net debts remain at historically low levels - we carry £1.6bn of Total net debts including leases, with £350m of financial borrowings due to be repaid in the next three years. Due to our strong liquidity position, we repaid term loans totalling £150m during the first half of this year, which were due to mature in the second half. Total net debts have increased since January 2022 from £1.4bn to £1.6bn. While there has been a reduction in gross debt, predominantly driven by £150m of early loan repayments, this has been more than offset by the total cash outflow during the half.
Liquidity has dropped by £0.4bn, reflecting repayment of £150m term loans, a net operating cash outflow of £91m, after taking into account Partnership Bonus payment of £46m, as well as continued capital investment. Net operating cash outflow has deteriorated compared to last half year largely due to weaker profit performance and increased investment in working capital, as we recover from global supply chain disruption that impacted the industry throughout 2021 and secure stocks for the second half.
Our debt ratio at the end of last year was 2.3x; we do not update our debt ratio at the half year due to the seasonality of our annual performance.
|
|
|
Jul 22 |
Jan 22 |
Jul 21 |
|
Total liquidity (£m) |
|
1,475 |
1,931 |
1,925 |
|
Total net debts (£m) |
|
(1,635) |
(1,413) |
(1,693) |
|
Debt ratio (year end only) |
|
- |
2.3x |
- |
Pensions
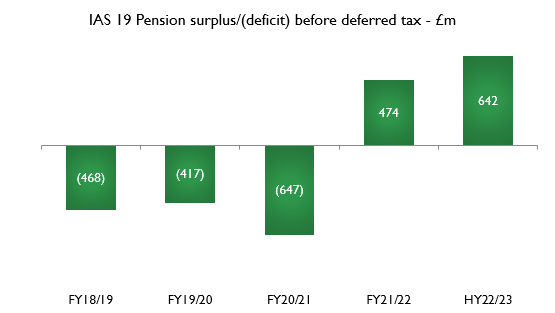
Our accounting position reflects the gap between the market value of pension assets held by our defined benefit scheme and our pension liabilities. At January 2022, we had an accounting pension surplus before deferred tax of £474m (£331m post deferred tax). At the half year, this has improved to £642m (£459m post deferred tax).
The improvement since January 2022 of £168m pre-tax is due to a reduction in the present value of pension liabilities offset by a reduction in value of associated liability linked investments, designed to limit the pension schemes exposure to discount rate and inflation. The valuation of liabilities has decreased as a result of higher discount rates being used to assess present values of future payments, in line with market projections reflecting expectations of interest rate rises. While the impact of higher inflation has increased the liabilities, this is more than offset by the increased discount rate.
Our pension valuation is derived from a number of assumptions, any of which can change the overall valuation substantially given the large size of the scheme. The valuation is at a point in time and changes in market conditions can substantially affect this position in the future. The pension scheme is subject to a triennial valuation which is underway as at 31 March 2022.
John Lewis plc
Chris Wynn, Partner & Director of Communications, 07980 242019, [email protected]
Parveen Johal, Partner & Senior Communications Manager, 07768 568644, [email protected]
Media Relations team, 01344 825 080, [email protected]
Debt investors: Lynn Lochhead, Partner & Head of Treasury, [email protected]
Throughout the interim results, alternative performance measures (APMs) have been reported. These are non-GAAP measures and are presented to provide stakeholders with additional financial information on the performance of the Group. These APMs should not be viewed in isolation or as an alternative to the equivalent GAAP measure.
The measures detailed below are not defined by UK-adopted IFRS and therefore may not be directly comparable with other companies' APMs - this includes those in the retail industry.
|
26 weeks to 30 July 2022 |
Waitrose £m |
John Lewis £m |
Group £m |
|
Total trading sales |
3,584 |
2,136 |
5,720 |
|
Deduct: |
|
|
|
|
Value added tax |
(209) |
(347) |
(556) |
|
Sale or return and other accounting adjustments |
(64) |
(152) |
(216) |
|
Revenue |
3,311 |
1,637 |
4,948 |
|
|
|
|
|
|
26 weeks to 31 July 2021 |
Waitrose £m |
John Lewis £m |
Group £m |
|
Total trading sales |
3,792 |
2,082 |
5,874 |
|
Deduct: |
|
|
|
|
Value added tax |
(221) |
(338) |
(559) |
|
Sale or return and other accounting adjustments |
(56) |
(106) |
(162) |
|
Revenue |
3,515 |
1,638 |
5,153 |
|
|
26 weeks to 30 July 2022 £m |
26 weeks to 31 July 2021 £m |
|
Operating (loss)/profit |
(59) |
47 |
|
Add back: |
|
|
|
Exceptional items |
7 |
98 |
|
Deduct: |
|
|
|
Net finance costs |
(40) |
(76) |
|
(Loss)/profit before Partnership Bonus, tax and exceptional items |
(92) |
69 |
|
|
26 weeks to 30 July 2022 £m |
26 weeks to 31 July 2021 £m |
|
Loss before tax |
(99) |
(29) |
|
Add back: |
|
|
|
Exceptional items |
7 |
98 |
|
(Loss)/profit before Partnership Bonus, tax and exceptional items |
(92) |
69 |
|
APM |
DEFINITION, PURPOSE AND RECONCILIATION |
|||||||||||||||||||||||||||||||||||||||||||||
|
Adjusted cash flow |
Not updated at half year. Operating profit before Partnership Bonus, exceptional items, depreciation and amortisation, but after lease adjusted interest and tax. This measure is important to assess our debt ratio.
|
|
||||||||||||||||||||||||||||||||||||||||||||
|
Debt ratio |
Not updated at half year. Comparison of our Total net debts to Adjusted cash flow. This measure is important as it provides an indication of our ability to repay our debts.
|
|
||||||||||||||||||||||||||||||||||||||||||||
|
(Loss)/profit before Partnership Bonus, tax and exceptional items (PBTBE) |
(Loss)/profit before Partnership Bonus, tax and exceptional items. This measure is important as it allows for a comparison of underlying profit performance.
|
|
|
APM |
DEFINITION, PURPOSE AND RECONCILIATION |
|||||||||||||||||||||||||||||||||||||||||||||||||||||||||||||||||||||||||||||||||||||||||||||||||
|
Total liquidity |
The cash, short-term investments and undrawn committed credit facilities we have available to us, which we can use to settle liabilities as they fall due. |
|||||||||||||||||||||||||||||||||||||||||||||||||||||||||||||||||||||||||||||||||||||||||||||||||
|
Total net debts |
The Group's borrowings and overdrafts, lease liabilities, derivative financial instruments and IAS 19 pension deficit (net of deferred tax), less any liquid cash, short-term deposits and investments. This measure is important to assess our debt ratio (not updated at half year).
|
|||||||||||||||||||||||||||||||||||||||||||||||||||||||||||||||||||||||||||||||||||||||||||||||||
|
Total trading sales |
Total trading sales represents the full customer sales value, including VAT, that is used to assess ongoing sales performance. It is before adjustment for sale or return sales and other accounting adjustments. A reconciliation between Total trading sales and Revenue is provided above. |
|||||||||||||||||||||||||||||||||||||||||||||||||||||||||||||||||||||||||||||||||||||||||||||||||
|
Trading operating profit (TOP) |
Trading operating profit represents operating profits used to assess the performance of the John Lewis and Waitrose brands and determine the allocation of resources to them. It excludes centrally managed costs, including fixed property costs and depreciation.
|
|
TERM |
DEFINITION |
|
|
Amortisation
|
An expense recorded to write down intangible assets to their residual values over their useful economic lives (UELs). |
|
|
Assets |
Something of value that the Group owns, benefits from, or has use of, in generating income or cash. |
|
|
Balance sheet |
A financial statement that shows assets, liabilities and capital/equity at a particular point in time, giving a summary of what the Group/Company owns and what it owes. |
|
|
Capital investment/ expenditure |
Cash outflows in relation to additions to tangible assets (property, plant and equipment), and intangible assets (IT software) recognised on the balance sheet. |
|
|
Cash flow (statement of) |
A financial statement that shows how changes in balance sheet accounts, income and expenses affect cash and cash equivalents. It breaks the analysis down to operating, investing and financing activities. It is a measure of cash generation, working capital efficiency and capital discipline of the business. |
|
|
Click & Collect |
A service offered through Johnlewis.com to enable customers to buy or order goods and collect from a local Waitrose or John Lewis. |
|
|
Committed credit facilities |
Similar to a personal overdraft, this is an agreement with banks to provide the Group with additional funds as and when we might require. |
|
|
Cost of sales |
The cost to the business of producing and purchasing goods sold over a specific period of time. |
|
|
Debt |
Money the Group has borrowed which it is required to repay. |
|
|
Depreciation |
An expense recorded to write down non-current assets to their residual values over their useful economic lives (UELs). |
|
|
Exceptional items |
Items of income and/or expense which are significant by virtue of their size and nature are presented as exceptional items. The separate reporting of exceptional items helps to provide an indication of the Group's underlying business performance. |
|
|
Financial year |
The period of 364 days, or 52 weeks, running from 30 January 2022 to 28 January 2023. |
|
|
GAAP |
Generally Accepted Accounting Practice. Non-GAAP measures are those which are not required under UK-adopted IFRS, but are included to enhance the relevance and usefulness of the financial statements. |
|
|
Impairment |
A reduction in the value of an asset due to a fall in the expected future economic benefits generated by the asset. |
|
|
Investment |
Total investment spend includes capital investment, revenue investment, restructuring and redundancy costs, and lease disposal costs. |
|
|
Lease |
A contract in which one party lends land, property or services to another for a specified period of time, usually in return for payment. |
|
|
Like-for-like (LFL) sales |
Comparison of sales between two periods in time (e.g. this year to last year), removing the impact of shop openings and closures. Waitrose like-for-like sales excludes fuel. |
|
|
Liquid cash |
Immediately available cash in bank. |
|
|
Margin (gross) |
The difference between a product or service's selling price and its cost of purchase/production. |
|
|
TERM |
DEFINITION |
|
|
Net finance costs |
Interest payable on our borrowings, our defined benefit pension scheme and long leave scheme, offset by interest received from investments. |
|
|
Operating profit/(loss) |
Profit/(loss) earned by the Group over a specific period of time, before accounting for net finance costs and tax. |
|
|
Partners (members) |
The name given to all employees of the John Lewis Partnership. |
|
|
Pension surplus/deficit (accounting) |
The accounting pension surplus or deficit presented in the balance sheet represents the difference between the fair value of the plan assets and the present value of the defined benefit obligation at the balance sheet date. It is presented in accordance with the requirements of IAS 19, which requires all companies to assume their pension fund grows at a standard rate reflecting a relatively low level of risk. |
|
|
Profit/(loss) before tax (PBT or LBT) |
Profit/(loss) generated by the Group over a specific period of time, before accounting for tax. |
|
|
Restructuring |
A change to internal organisational structures, designed to streamline processes and create more efficient and cost-effective ways of working. |
|
|
Revenue investment |
Investment spend recognised directly in the income statement. |
|
|
Short-term investments |
Cash placed with financial institutions (such as banks) for a period of between three months and a year. The Group receives more interest on these short-term investments compared to immediately accessible cash kept in bank accounts. |
|
|
Trading operating profit % |
Trading operating profit divided by Total trading sales. |
|
|
Value added tax (VAT) |
A tax on the sales value of a product or service which is collected by HMRC. |
|
|
Working capital |
The cash the Group utilises as part of its day-to-day trading operations. This includes aspects such as the money tied up in stock, the money we owe to suppliers for goods we haven't yet paid for, and any money we may be owed from customers and suppliers. |
|
Notes |
|
26 weeks to 30 July 2022 |
26 weeks to 31 July 2021 |
52 weeks to 29 January 2022 |
|
|
|
£m |
£m |
£m |
|
6 |
Revenue |
4,948.0 |
5,152.8 |
10,837.5 |
|
|
Cost of sales |
(3,423.7) |
(3,512.5) |
(7,359.4) |
|
|
Gross profit |
1,524.3 |
1,640.3 |
3,478.1 |
|
|
Other operating income |
59.6 |
50.2 |
108.1 |
|
|
Operating and administrative expenses |
(1,642.8) |
(1,644.1) |
(3,469.5) |
|
|
of which: |
|
|
|
|
4 |
Exceptional items (net) |
(6.8) |
(97.9) |
(160.8) |
|
|
Partnership Bonus |
- |
- |
(46.4) |
|
|
Share of (loss)/profit of joint venture (net of tax) |
(0.2) |
0.5 |
1.0 |
|
5 |
Operating (loss)/profit |
(59.1) |
46.9 |
117.7 |
|
7 |
Finance costs |
(70.9) |
(79.9) |
(155.2) |
|
7 |
Finance income |
30.8 |
4.4 |
10.3 |
|
|
Loss before tax |
(99.2) |
(28.6) |
(27.2) |
|
|
Taxation |
20.2 |
(11.8) |
(41.1) |
|
|
Loss for the period |
(79.0) |
(40.4) |
(68.3) |
|
5 |
(Loss)/profit before Partnership Bonus, tax and exceptional items |
(92.4) |
69.3 |
180.0 |
|
Notes |
|
26 weeks to 30 July 2022 |
26 weeks to 31 July 2021 |
52 weeks to 29 January 2022 |
|
|
|
£m |
£m |
£m |
|
|
Loss for the period |
(79.0) |
(40.4) |
(68.3) |
|
|
Other comprehensive income/(expense): |
|
|
|
|
|
Items that will not be reclassified to profit or loss: |
|
|
|
|
11 |
Remeasurement of defined benefit pension scheme |
161.3 |
484.8 |
1,116.9 |
|
|
Movement in deferred tax on pension scheme |
(46.8) |
(81.1) |
(241.2) |
|
|
Movement in current tax on pension scheme |
- |
1.0 |
1.9 |
|
|
Items that may be reclassified subsequently to profit or loss: |
|
|
|
|
|
Fair value gain/(loss) on cash flow hedges |
32.7 |
(8.5) |
(2.1) |
|
|
Cash flow hedge loss reclassified and reported in the consolidated income statement |
(2.7) |
- |
(1.0) |
|
|
Movement in deferred tax on cash flow hedges |
- |
(0.5) |
(3.5) |
|
|
Loss on foreign currency |
(0.2) |
- |
- |
|
|
Other comprehensive income for the period |
144.3 |
395.7 |
871.0 |
|
|
Total comprehensive income for the period |
65.3 |
355.3 |
802.7 |
|
Notes |
|
30 July 2022 |
31 July 2021 |
29 January 2022 |
|
|
|
£m |
£m |
£m |
|
|
Non-current assets |
|
|
|
|
9 |
Intangible assets |
440.9 |
456.4 |
446.0 |
|
9 |
Property, plant and equipment |
2,891.3 |
2,941.2 |
2,927.4 |
|
9 |
Right-of-use assets |
1,405.0 |
1,515.6 |
1,473.3 |
|
|
Trade and other receivables |
15.2 |
15.8 |
15.8 |
|
13 |
Derivative financial instruments |
5.9 |
0.8 |
1.7 |
|
|
Investment in and loans to joint venture |
4.2 |
3.7 |
4.4 |
|
|
Deferred tax asset |
- |
14.1 |
0.5 |
|
11 |
Retirement benefit surplus |
658.1 |
- |
492.8 |
|
|
|
5,420.6 |
4,947.6 |
5,361.9 |
|
|
Current assets |
|
|
|
|
|
Inventories |
722.7 |
629.7 |
655.7 |
|
|
Trade and other receivables |
342.5 |
312.4 |
331.7 |
|
|
Current tax receivable |
5.3 |
0.3 |
- |
|
13 |
Derivative financial instruments |
24.9 |
5.5 |
6.0 |
|
|
Short-term investments |
110.3 |
391.8 |
95.3 |
|
|
Cash and cash equivalents |
944.6 |
1,032.8 |
1,415.4 |
|
|
|
2,150.3 |
2,372.5 |
2,504.1 |
|
|
Total assets |
7,570.9 |
7,320.1 |
7,866.0 |
|
|
Current liabilities |
|
|
|
|
13 |
Borrowings and overdrafts |
- |
- |
(150.0) |
|
|
Trade and other payables |
(1,684.4) |
(1,618.4) |
(1,806.9) |
|
|
Current tax payable |
- |
- |
(0.5) |
|
13 |
Lease liabilities |
(160.4) |
(135.8) |
(156.6) |
|
10 |
Provisions |
(99.5) |
(207.7) |
(140.8) |
|
13 |
Derivative financial instruments |
(4.5) |
(20.3) |
(8.4) |
|
|
|
(1,948.8) |
(1,982.2) |
(2,263.2) |
|
|
Non-current liabilities |
|
|
|
|
13 |
Borrowings |
(639.7) |
(794.5) |
(641.6) |
|
|
Trade and other payables |
(28.0) |
(41.3) |
(30.0) |
|
13 |
Lease liabilities |
(1,778.9) |
(1,879.8) |
(1,831.7) |
|
10 |
Provisions |
(152.6) |
(169.6) |
(161.2) |
|
13 |
Derivative financial instruments |
(4.1) |
(0.6) |
(0.8) |
|
121 |
Retirement benefit obligations |
(15.7) |
(163.9) |
(19.3) |
|
|
Deferred tax liability |
(202.8) |
(5.2) |
(177.5) |
|
|
|
(2,821.8) |
(3,054.9) |
(2,862.1) |
|
|
Total liabilities |
(4,770.6) |
(5,037.1) |
(5,125.3) |
|
|
Net assets |
2,800.3 |
2,283.0 |
2,740.7 |
|
|
Equity |
|
|
|
|
|
Share capital |
6.7 |
6.7 |
6.7 |
|
|
Share premium |
0.3 |
0.3 |
0.3 |
|
|
Other reserves |
25.4 |
(11.4) |
1.3 |
|
|
Retained earnings |
2,767.9 |
2,287.4 |
2,732.4 |
|
|
Total equity |
2,800.3 |
2,283.0 |
2,740.7 |
|
|
|
Share capital |
Share premium |
Capital reserve |
Hedging reserve |
Foreign currency translation reserve |
Retained earnings |
Total equity |
|
Notes |
|
£m |
£m |
£m |
£m |
£m |
£m |
£m |
|
|
Balance at 30 January 2021 |
6.7 |
0.3 |
1.4 |
(14.5) |
0.4 |
1,923.1 |
1,917.4 |
|
|
Loss for the period |
- |
- |
- |
- |
- |
(40.4) |
(40.4) |
|
11 |
Remeasurement of defined benefit pension scheme |
- |
- |
- |
- |
- |
484.8 |
484.8 |
|
|
Fair value loss on cash flow hedges |
- |
- |
- |
(8.5) |
- |
- |
(8.5) |
|
|
Tax on above items recognised in equity |
- |
- |
- |
(0.5) |
- |
(80.1) |
(80.6) |
|
|
Total comprehensive income/(expense) for the period |
- |
- |
- |
(9.0) |
- |
364.3 |
355.3 |
|
|
Transfers to inventories |
- |
- |
- |
10.3 |
- |
- |
10.3 |
|
|
Balance at 31 July 2021 |
6.7 |
0.3 |
1.4 |
(13.2) |
0.4 |
2,287.4 |
2,283.0 |
|
|
|
|
|
|
|
|
|
|
|
|
Balance at 30 January 2021 |
6.7 |
0.3 |
1.4 |
(14.5) |
0.4 |
1,923.1 |
1,917.4 |
|
|
Loss for the year |
- |
- |
- |
- |
- |
(68.3) |
(68.3) |
|
11 |
Remeasurement of defined benefit pension scheme |
- |
- |
- |
- |
- |
1,116.9 |
1,116.9 |
|
|
Fair value loss on cash flow hedges |
- |
- |
- |
(2.1) |
- |
- |
(2.1) |
|
|
Cash flow hedge loss reclassified and reported in the consolidated income statement |
- |
- |
- |
(1.0) |
- |
- |
(1.0) |
|
|
Tax on above items recognised in equity |
- |
- |
- |
(3.5) |
- |
(239.3) |
(242.8) |
|
|
Total comprehensive income/(expense) for the period |
- |
- |
- |
(6.6) |
- |
809.3 |
802.7 |
|
|
Transfers to inventories |
- |
- |
- |
20.6 |
- |
- |
20.6 |
|
|
Balance at 29 January 2022 |
6.7 |
0.3 |
1.4 |
(0.5) |
0.4 |
2,732.4 |
2,740.7 |
|
|
Loss for the period |
- |
- |
- |
- |
- |
(79.0) |
(79.0) |
|
11 |
Remeasurement of defined benefit pension scheme |
- |
- |
- |
- |
- |
161.3 |
161.3 |
|
|
Fair value gain on cash flow hedges |
- |
- |
- |
32.7 |
- |
- |
32.7 |
|
|
Cash flow hedge loss reclassified and reported in the consolidated income statement |
- |
- |
- |
(2.7) |
- |
- |
(2.7) |
|
|
Tax on above items recognised in equity |
- |
- |
- |
- |
- |
(46.8) |
(46.8) |
|
|
Loss on currency translations |
- |
- |
- |
- |
(0.2) |
- |
(0.2) |
|
|
Total comprehensive income/(expense) for the period |
- |
- |
- |
30.0 |
(0.2) |
35.5 |
65.3 |
|
|
Transfers to inventories |
- |
- |
- |
(5.7) |
- |
- |
(5.7) |
|
|
Balance at 30 July 2022 |
6.7 |
0.3 |
1.4 |
23.8 |
0.2 |
2,767.9 |
2,800.3 |
|
Notes |
|
26 weeks to 30 July 2022 |
26 weeks to 31 July 2021 |
52 weeks to 29 January 2022 |
|
|
|
£m |
£m |
£m |
|
13 |
Cash generated from operations before Partnership Bonus |
16.4 |
233.3 |
668.7 |
|
|
Net taxation (paid)/received |
(7.0) |
5.6 |
2.1 |
|
|
Pension deficit reduction payments |
(5.0) |
(5.0) |
(10.0) |
|
|
Finance costs paid |
(48.9) |
(53.0) |
(105.5) |
|
|
Net cash (used in)/generated from operating activities before Partnership Bonus |
(44.5) |
180.9 |
555.3 |
|
|
Partnership Bonus paid |
(46.1) |
- |
- |
|
|
Net cash (used in)/generated from operating activities after Partnership Bonus |
(90.6) |
180.9 |
555.3 |
|
|
Cash flows from investing activities |
|
|
|
|
|
Purchase of property, plant and equipment |
(91.8) |
(77.4) |
(205.7) |
|
|
Purchase of intangible assets |
(61.6) |
(53.3) |
(109.1) |
|
|
Proceeds from sale of property, plant and equipment and intangible assets |
1.1 |
10.9 |
11.0 |
|
|
Finance income received |
2.8 |
0.3 |
0.9 |
|
|
Cash outflow from short-term investments |
(15.0) |
(391.5) |
(95.0) |
|
|
Net cash used in investing activities |
(164.5) |
(511.0) |
(397.9) |
|
|
Cash flows from financing activities |
|
|
|
|
|
Finance costs paid in respect of bonds |
- |
- |
(31.1) |
|
|
Finance (costs paid)/income received in respect of financial instruments |
(2.9) |
(2.5) |
1.0 |
|
|
Payment of capital element of leases |
(62.8) |
(77.8) |
(155.1) |
|
|
Cash outflow from borrowings |
(150.0) |
(75.0) |
(75.0) |
|
|
Net cash used in financing activities |
(215.7) |
(155.3) |
(260.2) |
|
|
Decrease in net cash and cash equivalents |
(470.8) |
(485.4) |
(102.8) |
|
|
Net cash and cash equivalents at beginning of the period |
1,415.4 |
1,518.2 |
1,518.2 |
|
|
Net cash and cash equivalents at end of the period |
944.6 |
1,032.8 |
1,415.4 |
|
|
Net cash and cash equivalents comprise: |
|
|
|
|
|
Cash at bank and in hand |
158.1 |
162.8 |
162.5 |
|
|
Short-term deposits |
786.5 |
870.0 |
1,252.9 |
|
|
|
944.6 |
1,032.8 |
1,415.4 |
This condensed set of interim financial statements was approved by the Board on 14 September 2022. The condensed set of interim financial statements do not comprise statutory accounts within the meaning of Section 434 of the Companies Act 2006. The condensed set of interim financial statements is unaudited and has not been reviewed by the auditor. The comparative information for the 26 weeks to, or as at, 31 July 2021 has not been audited or reviewed.
The results for the 26 weeks to 30 July 2022 have been prepared using the discrete period approach, considering the interim period as an accounting period in isolation. The tax charge is based on the effective rate estimated for the full year, which has been applied to the loss in the 26 weeks to 30 July 2022.
The Group's published financial statements for the 52 weeks to 29 January 2022 have been reported on by the Group's auditor and filed with the Registrar of Companies. The report of the auditor was unqualified, did not contain an emphasis of matter paragraph and did not contain any statement under section 498 of the Companies Act 2006.
This condensed set of interim financial statements for the 26 weeks ended 30 July 2022 has been prepared in accordance with UK-adopted IAS 34 'Interim Financial Reporting'. The condensed set of interim financial statements should be read in conjunction with the Annual Report and Accounts for the 52 weeks to 29 January 2022, which have been prepared in accordance with UK-adopted International Financial Reporting Standards (UK-adopted IFRS). Changes to significant accounting policies are described in note 2.
Going concern
In determining the appropriate basis of preparation of the condensed set of interim financial statements for the period ended 30 July 2022, the Directors are required to consider whether the Group can continue in operational existence for a period of at least 12 months from the approval of these financial statements. The Board has concluded that it is appropriate to adopt the going concern basis, having undertaken a rigorous assessment of the financial forecasts with specific consideration to the trading position of the Group, for the reasons set out below.
As at 30 July 2022, the Group had total assets less current liabilities of £5.6bn and net assets of £2.8bn. Liquidity as at that date remains strong at £1.5bn, made up of cash and cash equivalents, short-term investments and an undrawn syndicated credit facility of £0.4bn. This is lower than at January 2022, reflecting that due to our strong liquidity position, we repaid early term loans totalling £150m during the first half of this year which were due to mature in the second half.
The Directors have modelled a severe downside scenario to cover the going concern assessment period, being for the 12 month period ending September 2023. In addition, the Directors have modelled a further period to January 2024 in order to ensure that the entire trading year is considered as this aligns with our bond covenants. For the purposes of the going concern assessment, it is assumed that all Group borrowings are repaid at their maturity date and that no further refinancing or funding is undertaken.The severe downside case represents an increasingly severe but plausible scenario which includes the impact of the high levels of inflation facing the UK economy.
In this severe downside scenario, Waitrose and John Lewis remain operational both in-store and online, albeit with sales and margin pulled back from current trading levels due to a UK economic recession throughout the assessment period. This results in a reduction in sales, as well as a reduction in margin across both brands. It also includes a number of one-off events, e.g. a regulatory and data security breach, higher impairment charge, a decrease in pension scheme assets and under-delivery of key activities of the Partnership Plan. The impact of the severe downside adjustments has been reviewed against the Group's projected cash position and financial covenants. Should these occur, mitigating actions would be required to ensure that the Group remains liquid and financially viable.
Going concern (continued)
The severe downside model has a significant adverse impact on sales, margin, costs and cash flow. In response, the Directors have identified available mitigations in the going concern assessment period, all within management's control, to reduce costs and optimise the Group's cash flow, liquidity and covenant headroom. The majority of these mitigations would only be triggered in the event of the severe downside scenario materialising. Mitigating actions include, but are not limited to, reducing capital and investment expenditure through postponing or pausing projects and change activity; deferring or cancelling discretionary spend including discretionary Partner benefits; and reducing marketing spend.
The Group has a syndicated credit facility of £420m which matures in 2026 and is at present undrawn. This syndicated credit facility contains one financial performance covenant, which is a profit based covenant ('Fixed Charge Cover'). The severe downside scenario modelled indicates that without mitigating actions this would breach at the next balance sheet date due to the reduction in profits modelled. However, whilst the scenario indicates this covenant would breach, the model also shows that post mitigating actions the cash low point would recover to £681m and the covenants would not breach and therefore the syndicated credit facility would remain undrawn. The Group seeks to retain the option to utilise its syndicated credit facility, therefore, covenant compliance will continue to be monitored closely. If considered necessary, the Group will seek a covenant relaxation from its bank group, or take other actions to replace the level of liquidity support provided by the syndicated credit facility.
The severe downside detailed above is deemed by the Directors to provide a severe but plausible stress test on our ability to adopt the going concern basis. This includes a significant reduction in 2022/23 performance and reduced trading performance across both brands, resulting in a pre-mitigation cash reduction to forecast. We have made our assessment based on our best view of the severe but plausible downside scenario that we might face. If outcomes are unexpectedly significantly worse, the Directors would need to consider what additional mitigating actions were needed, for example, accessing the value of our asset base to support liquidity.
Consequently, the Directors have concluded that the Group will have sufficient funds to continue to meet its liabilities as they fall due for at least 12 months from the date of approval of the condensed set of interim financial statements and therefore have prepared the financial statements on a going concern basis.
The Group's results for the 26 weeks to 30 July 2022 have been prepared on a basis consistent with the Group's accounting policies published in the financial statements for the 52 weeks to 29 January 2022.
A number of amendments to, and the interpretation of, existing accounting standards became effective during the period, none of which have had a significant impact on the condensed interim financial statements.
The Group has a formal risk identification process, which includes a rigorous analysis of internal and external risks within leadership teams, at the Executive Team, Audit and Risk Committee, Ethics and Sustainability Committee and the Group Board. The principal risks and uncertainties affecting the Group were reported in the Strategic Report, set out on pages 33 to 39 of the John Lewis Partnership Annual Report and Accounts 2022, a copy of which is available on the Partnership's website www.johnlewispartnership.co.uk. The majority of risks remain relevant for the second half of the financial year with two notable exceptions:
● External Environment: Greater focus was required on the Group's response to the external environment rather than the impact that external pressures had on our 'business as usual' (BAU) operations. Consequently, the External Environment risk was replaced in Q1 2022/23 by two new risks:
○ 'Insufficient Profit to Achieve Our Purpose', to facilitate targeted management of the financial levers that can be pulled in response to external pressures, and;
○ 'Strategic Resilience', ensuring sufficient focus on our response to the changes in the external environment, fast enough to secure the future success of the Group.
● Liquidity: This was removed as a principal risk in Q4 2021/22 when the risk reached appetite as a result of securing the £420m Revolving Credit Facility (RCF) which comprised the main mitigating action, and ending the financial year in a stronger cash position than expected. The risk continues to be managed by the Finance Leadership Team and has been managed effectively down from a principal risk.
As the threat of Covid-19 reduces, inflation, recession, consumer confidence, high demand for resources in key skill areas, supply chain disruption and rising energy costs continue to challenge the pace of our strategy delivery and remain our focus.
Our principal risks are:
● Proposition: Failure to deliver profitable, market-leading propositions to inspire our customers and maintain competitive advantage;
● Partner Differentiation: The responsibilities and benefits of membership are not sufficiently felt and experienced by Partners and/or do not drive a distinctive and better business in service of our purpose;
● Information Security: Loss of key customer, Partner and/or commercially sensitive data leading to financial, regulatory, legal, operational and reputational issues;
● Insufficient Profit to Achieve Our Purpose: Risk that we won't make sufficient profit to achieve our Purpose; the impact of which would be a combination of reduced competitiveness and ultimately commercial failure, loss of Partner faith and democratic vitality due to lack of suitable Partner rewards endangering our Group model, and inability to maintain our distinctive character;
● Change Delivery: Change does not realise the desired benefits and drives unforeseen cost and consequences;
● Customer Experience: Customers do not receive differentiated, excellent customer service across touchpoints;
● Regulatory Non-compliance: Failure to comply with key regulatory requirements;
● Ethics and Sustainability: Failure to live up to our ethics and sustainability ambition;
● Partner Wellbeing: Partners' sense of wellbeing is threatened by societal and organisational uncertainty and change.
Looking forward to the second half of the year, the Group will continue to monitor the Bank of England warnings of UK economic recession expected to land in Q4 2022/23 and the impact of the cost of living increase on consumer behaviour. Emerging risks around business resilience and Partner retention will be monitored and mitigating actions taken.
4 Exceptional items
|
|
26 weeks to 30 July 2022 |
26 weeks to 31 July 2021 |
52 weeks to 29 January 2022 |
|||
|
|
Operating (expenses)/ income £m |
Taxation (charge)/ credit £m |
Operating (expenses)/ income £m |
Taxation credit/ (charge) £m |
Operating (expenses)/ income £m |
Taxation credit/ (charge) £m |
|
Strategic restructuring and redundancy programmes |
|
|
|
|
|
|
|
Physical estate |
(4.7) |
(0.3) |
(63.4) |
6.8 |
(108.0) |
2.5 |
|
Shop operations |
(2.2) |
(0.5) |
(41.3) |
9.9 |
(41.4) |
7.9 |
|
Head office reviews |
0.1 |
- |
7.4 |
(1.7) |
11.7 |
(2.2) |
|
|
(6.8) |
(0.8) |
(97.3) |
15.0 |
(137.7) |
8.2 |
|
Store impairments - John Lewis |
- |
0.1 |
(0.6) |
(2.6) |
(23.1) |
3.0 |
|
Store impairments - Waitrose |
- |
- |
- |
0.1 |
- |
- |
|
|
(6.8) |
(0.7) |
(97.9) |
12.5 |
(160.8) |
11.2 |
Strategic restructuring and redundancy programmes
The Partnership Plan is a five year plan that envisages a significant level of transformation to ensure the Group is thriving for both Partners and customers. Some of this transformation is in the form of restructuring.
The costs incurred over the life of the change programmes outlined are significant in value and, given the level of change, they are significant in nature. Therefore, the Group considers them exceptional items to provide a more meaningful view of the Group's underlying business performance.
During the first half of the year, the Group has updated our plans for the future of our London head office, whilst progressing with the restructuring programmes to our physical estate, shop operations and head office functions announced in previous periods. These programmes present significant deviations from normal operations for the Group, in terms of their size and nature, and are therefore presented as exceptional items. The financial impacts of these programmes are detailed below.
Physical estate: Since 2017, we have been working on our programme of rebalancing our existing estate. This includes ensuring that the size and shape of our physical estate is delivering on both our customer proposition and financial returns. With the launch of the Partnership Plan and the acceleration of change we have seen in customer shopping behaviour, we have refocused on the need to ensure our stores reflect how our customers want to shop - 'right space, right place' - and as a result we anticipate these changes will extend to 2025/26.
In the 2021/22 financial year, we negotiated the early surrender of the leasehold interest in the London head office. Since January 2022, plans for the use of this office space have developed and we have recognised an impairment charge of £7.9m, following the announcement to close seven floors.
In the 2021/22 financial year, we also announced the closure of eight John Lewis stores along with a customer distribution hub. These change programmes have progressed since January 2022 and, in the 26 weeks to 30 July 2022, we have recognised net income of £2.3m from the release of related provisions, as well as net gains of £0.9m on the disposal of related stores.
4 Exceptional items (continued)
Shop operations: Alongside the assessment of our physical estate, we also identified that the way in which we run and manage our shops would require adjustment. In order to improve the customer experience and efficiencies in our stores, we have made a number of changes in our shop operating models in order to deliver a more flexible, multi-skilled and productive model.
In July 2021, we announced the proposal to redesign management structures in Waitrose and John Lewis shops to be simpler and more flexible. This change programme has progressed since January 2022 and, in the 26 weeks to 30 July 2022, we have recognised a net charge of £2.2m.
Head office reviews: The redundancy programmes related to the transformation of head office operations have continued this year. This is part of the wider review of a number of pan Group functions which began at the end of 2017. These change programmes have progressed since January 2022 and, in the 26 weeks to 30 July 2022, we have recognised net income of £0.1m from the release of related provisions.
Store impairments - John Lewis
At July 2022, there was no charge to exceptional items (January 2022: £23.1m charge; July 2021: £0.6m charge). See note 9 for further detail.
Store impairments - Waitrose
At July 2022, there was no charge to exceptional items (January 2022: nil; July 2021: nil). See note 9 for further detail.
The Group's reporting segments are determined based on the internal financial reporting to the chief operating decision-maker (CODM) and is split by the business activities of its brands (John Lewis and Waitrose). The Executive Team reviews the operating performance for each brand (John Lewis and Waitrose) in the Group, using non-GAAP measures known as Total trading sales and Trading operating profit (TOP).
Total trading sales represents the full customer sales value including VAT as reported weekly to the Executive Team, before adjustments for sale or return sales and other accounting adjustments.
TOP is based on operating profit, but excludes centrally managed costs. These centrally managed costs are outside of the direct influence and control of the brands and are reviewed by the Executive Team at a Group level in aggregate. TOP is used to assess the performance of the John Lewis and Waitrose brands and determine the allocation of resources to those segments.
The Waitrose business is not subject to highly seasonal fluctuations although there is an increase in trading in the fourth quarter of the year. There is a more marked increase in the fourth quarter for the John Lewis business.
|
|
Waitrose £m |
John Lewis £m |
Group £m |
|
26 weeks to 30 July 2022 |
|
|
|
|
Total trading sales |
3,583.4 |
2,136.4 |
5,719.8 |
|
Value added tax |
(208.5) |
(346.9) |
(555.4) |
|
Sale or return and other accounting adjustments |
(63.6) |
(152.8) |
(216.4) |
|
Revenue |
3,311.3 |
1,636.7 |
4,948.0 |
|
Trading operating profit1 |
431.7 |
295.0 |
726.7 |
|
Other operating and administrative expenses2 |
|
|
(785.8) |
|
of which: |
|
|
|
|
Exceptional items (net) |
|
|
(6.8) |
|
Partnership Bonus |
|
|
- |
|
|
|
|
|
|
Operating loss |
|
|
(59.1) |
|
Finance costs |
|
|
(70.9) |
|
Finance income |
|
|
30.8 |
|
Loss before tax |
|
|
(99.2) |
|
Loss before Partnership Bonus, tax and exceptional items |
|
|
(92.4) |
2 Included in Other operating and administrative expenses is £243.5m of depreciation and amortisation.
5 Segmental reporting (continued)
|
|
Waitrose £m |
John Lewis £m |
Group £m |
|
26 weeks to 31 July 2021 |
|
|
|
|
Total trading sales |
3,792.5 |
2,081.7 |
5,874.2 |
|
Value added tax |
(221.2) |
(337.8) |
(559.0) |
|
Sale or return and other accounting adjustments |
(56.5) |
(105.9) |
(162.4) |
|
Revenue |
3,514.8 |
1,638.0 |
5,152.8 |
|
Trading operating profit1 |
524.6 |
295.0 |
819.6 |
|
Other operating and administrative expenses2 |
|
|
(772.7) |
|
of which: |
|
|
|
|
Exceptional items (net) |
|
|
(97.9) |
|
Partnership Bonus |
|
|
- |
|
|
|
|
|
|
Operating profit |
|
|
46.9 |
|
Finance costs |
|
|
(79.9) |
|
Finance income |
|
|
4.4 |
|
Loss before tax |
|
|
(28.6) |
|
Profit before Partnership Bonus, tax and exceptional items |
|
|
69.3 |
2 Included in Other operating and administrative expenses is £244.3m of depreciation and amortisation.
|
|
Waitrose £m |
John Lewis £m |
Group £m |
|
52 weeks to 29 January 2022 |
|
|
|
|
Total trading sales |
7,535.9 |
4,925.6 |
12,461.5 |
|
Value added tax |
(439.6) |
(797.5) |
(1,237.1) |
|
Sale or return and other accounting adjustments |
(112.7) |
(274.2) |
(386.9) |
|
Revenue |
6,983.6 |
3,853.9 |
10,837.5 |
|
Trading operating profit1 |
1,019.6 |
757.7 |
1,777.3 |
|
Other operating and administrative expenses2 |
|
|
(1,659.6) |
|
of which: |
|
|
|
|
Exceptional items (net) |
|
|
(160.8) |
|
Partnership Bonus |
|
|
(46.4) |
|
|
|
|
|
|
Operating profit |
|
|
117.7 |
|
Finance costs |
|
|
(155.2) |
|
Finance income |
|
|
10.3 |
|
Loss before tax |
|
|
(27.2) |
|
Profit before Partnership Bonus, tax and exceptional items |
|
|
180.0 |
1 Included in trading operating profit is other operating income of which £101.2m (split between operating segments: £30.8m Waitrose and £70.4m John Lewis) represents further income from external customers. This is reported to the CODM separately as part of other income and expenses.
2 Included in Other operating and administrative expenses is £481.7m of depreciation and amortisation.
Disaggregation of revenue from contracts with customers
The revenue recognition policy is unchanged from that described in the Annual Report and Accounts for the 52 weeks to 29 January 2022.
We analyse our revenue between goods and services. Goods are split into four major product lines: Grocery, Home, Fashion and Technology. Services comprise free service guarantees on selected goods. This presentation is consistent with how our Executive Team reviews performance. In line with our five year Partnership Plan, we expect our service offering to increase in the coming year and, as such, will keep this reporting under review including the classification of commission income from other services as other income rather than revenue.
|
|
26 weeks to 30 July 2022 £m |
26 weeks to 31 July 2021 £m |
52 weeks to 29 January 2022 £m |
|
Major product lines |
|
|
|
|
Goods |
|
|
|
|
- Grocery |
3,298.6 |
3,512.9 |
6,899.7 |
|
- Home |
485.2 |
501.7 |
1,119.8 |
|
- Fashion |
526.3 |
430.4 |
1,127.9 |
|
- Technology |
606.3 |
660.9 |
1,577.2 |
|
Services |
|
|
|
|
- Free warranty |
1.8 |
12.7 |
4.7 |
|
Other revenue |
29.8 |
34.2 |
108.2 |
|
|
4,948.0 |
5,152.8 |
10,837.5 |
|
|
26 weeks to 30 July 2022 |
26 weeks to 31 July 2021 |
52 weeks to 29 January 2022 |
|
|
£m |
£m |
£m |
|
Finance costs |
|
|
|
|
Finance costs in respect of borrowings and lease liabilities1 |
(68.2) |
(72.3) |
(143.7) |
|
Fair value measurements and other |
(2.7) |
(0.8) |
(2.8) |
|
Net finance costs arising on defined benefit retirement scheme |
- |
(5.0) |
(8.7) |
|
Net finance costs arising on other employee benefit schemes |
- |
(1.8) |
- |
|
Total finance costs |
(70.9) |
(79.9) |
(155.2) |
|
Finance income |
|
|
|
|
Finance income in respect of cash and short-term investments2 |
6.8 |
3.4 |
7.2 |
|
Fair value measurements and other |
2.1 |
1.0 |
3.1 |
|
Net finance income arising on defined benefit retirement scheme |
5.4 |
- |
- |
|
Net finance income arising on other employee benefit schemes |
16.5 |
- |
- |
|
Total finance income |
30.8 |
4.4 |
10.3 |
|
Net finance costs |
(40.1) |
(75.5) |
(144.9) |
1 Finance costs in respect of borrowings and lease liabilities include interest payable on interest rate swaps of £2.9m (July 2021: £2.5m; January 2022: £5.0m) and lease liabilities of £68.2m (July 2021: £49.2m; January 2022: £97.3m).
2 Finance income in respect of cash and short-term investments includes interest receivable on interest rate swaps of £3.1m (July 2021: £3.1m; January 2022: £6.1m).
Capitalised borrowing costs totalled £0.1m (July 2021: £0.3m; January 2022: £0.6m) of which £0.1m (July 2021: £nil; January 2022: £nil) were capitalised within intangible assets and £nil (July 2021: £0.3m; January 2022: £0.6m) were capitalised within property, plant and equipment.
Income tax expense is recognised based on management's best estimate of the full year effective tax rate based on estimated full year profits excluding any discrete items. The tax charge on discrete items at half year is calculated separately. The effective tax rate for the 26 weeks to 30 July 2022 is lower than would be expected for the full year. This is as a result of a significant number of discrete items expected at the full year.
9 Property, plant and equipment, Intangible assets, and Right-of-use assets
|
|
Property, plant and equipment |
Intangible assets |
Right-of-use assets |
Total |
|
|
£m |
£m |
£m |
£m |
|
Net book value at 29 January 2022 |
2,927.4 |
446.0 |
1,473.3 |
4,846.7 |
|
Additions1 |
86.7 |
60.7 |
20.4 |
167.8 |
|
Depreciation and amortisation2 |
(121.6) |
(65.2) |
(84.4) |
(271.2) |
|
Disposals and write-offs |
(1.2) |
(0.6) |
(4.3) |
(6.1) |
|
Net book value at 30 July 2022 |
2,891.3 |
440.9 |
1,405.0 |
4,737.2 |
1 For the period ended 30 July 2022, additions for the year include the non-cash capital expenditure accrual on property, plant and equipment of £29.0m (January 2022: £34.1m) and intangible assets of £1.6m (January 2022: £2.6m).
2 For the period ended 30 July 2022, depreciation and amortisation includes net impairment charges of £13.5m to right-of-use assets (January 2022: £15.9m charge) and £14.8m to land and buildings (January 2022: £21.5m charge), and an impairment release of £0.6m to fixtures and fittings (January 2022: £1.8m release).
Intangible assets primarily relate to internally developed computer software.
Right-of-use assets are recognised in relation to the Group's leases, representing the economic benefits of the Group's right to use the underlying leased assets. The Group's lease portfolio is principally comprised of property leases of land and buildings in relation to Waitrose and John Lewis (JL) stores, distribution centres and head offices. The Group also holds a number of vehicle and equipment leases and service agreements deemed to meet the definition of a lease under IFRS 16.
In accordance with IAS 36, the Group reviews its property, plant, intangible assets and right-of-use assets for impairment at least annually or whenever events or circumstances indicate that the value on the balance sheet may not be recoverable. The impairment review methodology is unchanged from that described in the Annual Report and Accounts for the 52 weeks to 29 January 2022.
The tangible impairment review compares the recoverable amount for each Cash Generating Unit (CGU), typically a store, to the carrying value on the balance sheet; this includes right-of-use assets. It considers the Value in Use (VIU) of a CGU compared to the carrying value in the first instance, and subsequently the fair value less cost to dispose if the VIU is lower than the CGU carrying value. The VIU calculation is based on four year cash flow projections using the latest forecast data. For JL, different growth expectations are applied to online and store sales. The forecasts are then extrapolated beyond the four year period using a long-term growth rate of 2% for both Waitrose and JL. The recoverable amounts of all impaired Waitrose CGUs are based on the VIU. For JL, there are two CGUs for which the recoverable amounts are the fair value less cost to dispose. The recoverable amounts of all other impaired JL CGUs are based on the VIU.
The key assumptions in the calculations are the expected sales and margin performance, cost inflation, the allocation of online sales and associated costs to stores in the determination of the JL store CGU, the market valuations considered in fair value less cost to dispose calculations and the discount rate. The latest view of future trading for both Waitrose and JL is based on finding a "new normal" after the disruption of the lockdowns and social restrictions as a result of the Covid-19 pandemic. The Group continues to monitor what the current economic challenges might mean for the long term and it has carefully considered the impacts of current trends - inflation, cost of living crisis and early stages of recession - against long-term performance expectations.
Following the impairment review, the Group recognised in operating expenses a net impairment charge of £15.1m for Waitrose stores and an impairment charge of £4.7m for JL stores. For JL, charges have historically met the criteria for recognition as exceptional items given changing customer behaviour, but the charges for this half year do not meet those same criteria. The Group has also recognised an impairment charge of £7.9m in exceptional items for its London office. The total impairment charge for the 26 weeks to 30 July 2022 is £27.7m.
The existing provisions have an underlying reduction due to utilisation of the provision, which is principally due to store exits: £7.4m for JL and £0.4m for Waitrose.
9 Property, plant and equipment, Intangible assets, and Right-of-use assets (continued)
John Lewis store impairment
The impact of the JL impairment review is a charge of £4.7m to operating expenses, largely due to a higher discount rate. There were no reversals of impairment charges.
Cash forecasts
The calculations use a post-tax cash flow based on a four year plan approved by the Group Board. The key assumptions in this plan are the recovery of JL store sales from the impact of Covid-19 restrictions, year-on-year sales growth, margin rates and cost inflation. The plan differentiates between online and store sales, which is relevant to our store CGUs that continue to include an allocation of online sales and associated costs.
For the JL business, there is ongoing market uncertainty and changing customer behaviours. The JL impairment estimation is most sensitive to changes in sales and margin forecasts, as well as the allocation of online sales and costs, and therefore sensitivity analysis has focused on these aspects of the impairment evaluation. Management's review of historical forecasts shows an average variance for the sales growth of 2.7%. Reducing the sales growth by this percentage would increase the JL impairment provision by £14.5m.
Online allocation
Judgement is required as to whether online sales and associated costs should be attributed to JL stores for the purposes of impairment evaluation. Our allocation of a proportion of online sales, made by customers who shop both online and in store (omnichannel), is supported by the omnichannel approach embedded in our strategy, management and operation of our stores. It reflects the role our stores play in providing customers with an opportunity to browse, touch and feel our product range before purchasing online. The merchandising of the product offer in our physical estate provides inspiration for our customers who may then choose to purchase online (in particular for larger items and more considered purchases in our Home offer). For these reasons, online sales are allocated to stores based on Click & Collect online sales, and also a further proportion of online sales to reflect the role the store plays in facilitating online purchases. This further allocation is based on evidence of a physical touchpoint with the store through previous purchasing behaviour. The allocations of the sales and weighting of the drivers (ie Click & Collect versus further allocation to reflect the role the store plays in facilitating online sales) varies by store.
Given the pace of change in customer behaviour and the transition to online purchasing, as well as the sensitivity of the JL impairment to the online allocation, management continue to consider how further changes could impact impairment. If the online allocation assumptions were reduced such that only online sales serviced through in-store Click & Collect were allocated to CGUs, this would further increase the impairment provision by £123.6m. If no online sales were attributed to the CGUs, the impairment provision would increase by £172.9m.
Market valuations
External market valuations are regularly obtained by the Group and used within the consideration of fair value less cost to dispose. This is an annual exercise completed ahead of each year end that considers the available market for department store properties.
Discount rate
The pre-tax discount rate of 13% (January 2022: 12%) used in the calculation of cash flows is derived from the JL Weighted Average Cost of Capital (WACC). This has increased since last year end, reflecting higher market inflation expectations and increased perceived risk in the bond market. An increase in the discount rate of 100 bps would increase the JL impairment charge by £6.7m.
9 Property, plant and equipment, Intangible assets, and Right-of-use assets (continued)
Waitrose store impairment
The impact of the Waitrose impairment review is a net charge of £15.1m within operating expenses. It includes the release of a previous impairment charge of £5.9m due to improved store performance which has been judged to be sustainable. This reversal has been more than offset by new impairment charges of £21.0m relating to the higher discount rate and performance deterioration on a small number of stores.
The impairment calculations for Waitrose stores use a post-tax cash flow based on a four year plan approved by the Board. The key assumptions in this plan are the stabilisation of sales following the pandemic disruption, year-on-year sales growth, margin rates and cost inflation. Waitrose online sales are allocated directly to the store that the online order is picked and fulfilled from. Online sales are therefore included in the Waitrose CGUs as the sales are directly attributable to store activity; this is not considered a key judgement.
The Waitrose customer fulfilment centres (CFCs) have been included in the impairment review alongside the store CGUs in a way that reflects the commercial reality that the CFCs are designed to serve specific regional postcodes of the UK alongside the stores.
The Waitrose impairment estimation is most sensitive to changes in the sales and margin forecasts. Management's review of historical forecasts shows an average variance for the sales growth of 0.6%. Reducing the sales growth by this percentage would increase the Waitrose impairment provision by £3.0m.
The pre-tax discount rate of 11% (January 2022: 10%) used in the calculation of cash flows is derived from the Waitrose WACC which has increased from last year end, reflecting higher market inflation expectations and increased perceived risk in the bond market. An increase in the discount rate of 100 bps would increase the Waitrose impairment provision by £9.0m.
|
|
Long leave £m |
Customer refunds £m |
Insurance claims £m |
Reorganisation
£m |
Other
£m |
Total
£m |
|
At 29 January 2022 |
(144.4) |
(24.8) |
(24.3) |
(49.6) |
(58.9) |
(302.0) |
|
Charged to income statement |
(6.4) |
(23.4) |
(9.3) |
(3.7) |
(7.6) |
(50.4) |
|
Released to income statement |
19.2 |
- |
- |
3.2 |
5.0 |
27.4 |
|
Utilised |
4.1 |
24.8 |
3.3 |
40.5 |
0.2 |
72.9 |
|
At 30 July 2022 |
(127.5) |
(23.4) |
(30.3) |
(9.6) |
(61.3) |
(252.1) |
|
|
|
|
|
|
|
|
|
Of which: |
|
|
|
|
|
|
|
Current |
(32.7) |
(23.4) |
(13.4) |
(9.6) |
(20.4) |
(99.5) |
|
Non-current |
(94.8) |
- |
(16.9) |
- |
(40.9) |
(152.6) |
The Group has a long leave scheme, open to all Partners, which provides up to six months paid leave after 25 years' service. There is no proportional entitlement for shorter periods of service. The provision for the liabilities under the scheme is assessed on an actuarial basis, reflecting Partners' expected service profiles, salary growth, National Insurance and overtime earnings assumptions. The discount rate applied differs from the discount rate used for the Group's retirement benefit obligations (note 11) as it reflects a rate appropriate to the shorter duration of the long leave liability so as to accrue the cost over Partners' service periods.
Provisions for customer refunds reflect the Group's expected liability for returns of goods sold, based on experience of rates of return.
Provisions for insurance claims are in respect of the Group's employer's public and vehicle third-party liability insurances. The provisions are based on reserves held in the Group's captive insurance company, JLP Insurance Limited. These reserves are established using independent actuarial assessments wherever possible, or a reasonable assessment based on past claims experience.
Provisions held for reorganisation relate to strategic restructuring and redundancy programmes; principally in relation to the ongoing review of the Group's physical estate, our shop management reorganisation, as well as head office and central function restructuring.
Other provisions primarily include property-related costs.
The pension scheme operated by the Group is the John Lewis Partnership Trust for Pensions. The scheme includes a defined benefit section, providing pensions and death benefits to members. All contributions to the defined benefit section of the scheme are funded by the Group. The defined benefit section of the scheme closed to new members and future accrual on 1 April 2020 and all active members of the scheme moved to become deferred members.
The scheme also includes a defined contribution section. Contributions to the defined contribution section of the scheme are made by both Partners and the Group.
Pension commitments recognised in these financial statements have been calculated based on the most recent completed actuarial valuations, as at 31 March 2019, which have been updated by the actuaries to reflect the assets and liabilities of the scheme as at 30 July 2022. The 31 March 2022 triennial actuarial valuation is currently in progress.
Scheme assets are stated at market value at 30 July 2022.
The following financial assumptions have been used:
|
|
|
30 July 2022 |
31 July 2021 |
29 January 2022 |
|
Discount rate |
3.60% |
1.70% |
2.30% |
|
|
Future retail price inflation (RPI) |
3.00% |
3.05% |
3.30% |
|
|
Future consumer price inflation (CPI) |
2.55% |
2.60% |
2.85% |
|
|
Increase in pensions - in payment |
|
|
|
|
|
|
Pre-April 1997 |
1.85% |
1.85% |
1.95% |
|
|
April 1997 - April 2016 |
2.85% |
2.85% |
3.05% |
|
|
Post-April 2016 |
1.85% |
1.85% |
1.95% |
|
Increase in pensions - deferred |
2.55% |
2.60% |
2.85% |
|
The movement in the net defined benefit surplus/(liability) in the period is as follows:
|
|
26 weeks to 30 July 2022 |
26 weeks to 31 July 2021 |
52 weeks to 29 January 2022 |
|
|
£m |
£m |
£m |
|
Net defined benefit asset/(liability) at beginning of period |
473.5 |
(646.9) |
(646.9) |
|
Operating cost/Pension expense |
(4.6) |
(3.9) |
(7.6) |
|
Interest cost on pension liabilities |
(76.5) |
(57.1) |
(114.0) |
|
Interest income on assets |
82.0 |
52.1 |
104.1 |
|
Contributions |
6.7 |
7.1 |
21.0 |
|
Total gains recognised in equity |
161.3 |
484.8 |
1,116.9 |
|
Net defined benefit asset/(liability) at end of period |
642.4 |
(163.9) |
473.5 |
|
of which: |
|
|
|
|
Total funded defined benefit asset/(liability) at end of period |
658.1 |
(143.2) |
492.8 |
|
Defined benefit obligation for unfunded arrangements |
(15.7) |
(20.7) |
(19.3) |
11 Retirement benefit obligations (continued)
The post-retirement mortality assumptions used in valuing the pension liabilities were based on the 'S2 Light' (29 January 2022: 'S2 Light'; 31 July 2021: 'S2 Light') series standard tables. Based on scheme experience, the probability of death at each age was multiplied by 127% for males and 106% for females who were non pensioners and 130% for males and 109% for females who were pensioners (29 January 2022: 127% for males and 106% for females who were non pensioners and 130% for males and 109% for females who were pensioners; 31 July 2021: 127% for males and 106% for females who were non pensioners and 130% for males and 109% for females who were pensioners). Future improvements in life expectancy have been allowed for in line with the latest CMI model projections subject to a long-term trend of 1.25% (29 January 2022: 1.25%; 31 July 2021: 1.25%). The average life expectancies assumed were as follows:
|
|
30 July 2022 |
31 July 2021 |
29 January 2022 |
|||
|
|
Men |
Women |
Men |
Women |
Men |
Women |
|
Average life expectancy for a 65 year old (in years) |
20.9 |
23.3 |
20.9 |
23.3 |
21.0 |
23.4 |
|
Average life expectancy at age 65, for a 50 year old (in years) |
21.9 |
24.6 |
21.9 |
24.6 |
22.0 |
24.7 |
12 Reconciliation of loss before tax to cash generated from operations before Partnership Bonus
|
|
26 weeks to 30 July 2022 |
26 weeks to 31 July 2021 |
52 weeks to 29 January 2022 |
|
|
£m |
£m |
£m |
|
Loss before tax |
(99.2) |
(28.6) |
(27.2) |
|
Amortisation and write offs of intangible assets1 |
65.8 |
64.9 |
129.4 |
|
Depreciation1 |
206.0 |
187.2 |
387.9 |
|
Share of loss/(profit) of joint venture (net of tax) |
0.2 |
(0.5) |
(1.0) |
|
Net finance costs |
40.1 |
75.5 |
144.9 |
|
Partnership Bonus |
- |
- |
46.4 |
|
Fair value losses/(gains) on derivative financial instruments |
0.1 |
(1.2) |
(1.2) |
|
(Profit)/loss on disposal of property, plant and equipment and intangible assets |
(2.6) |
2.3 |
51.6 |
|
(Increase)/decrease in inventories |
(70.0) |
14.2 |
(12.9) |
|
Increase in receivables |
(2.5) |
(50.1) |
(70.5) |
|
(Decrease)/increase in payables |
(91.0) |
(51.7) |
77.3 |
|
Increase/(decrease) in retirement benefit obligations |
2.9 |
1.8 |
(3.4) |
|
(Decrease)/increase in provisions |
(33.4) |
19.5 |
(52.6) |
|
Cash generated from operations before Partnership Bonus |
16.4 |
233.3 |
668.7 |
1 Includes net impairment charges
13 Analysis of net debt
|
|
29 January 2022 |
Cash flow |
Other non- cash movements |
30 July 2022 |
|
|
£m |
£m |
£m |
£m |
|
Non-current assets |
|
|
|
|
|
Derivative financial instruments |
1.7 |
- |
4.2 |
5.9 |
|
|
1.7 |
- |
4.2 |
5.9 |
|
Current assets |
|
|
|
|
|
Cash and cash equivalents |
1,415.4 |
(470.8) |
- |
944.6 |
|
Short-term investments |
95.3 |
15.0 |
- |
110.3 |
|
Derivative financial instruments |
6.0 |
(4.6) |
23.5 |
24.9 |
|
|
1,516.7 |
(460.4) |
23.5 |
1,079.8 |
|
Current liabilities |
|
|
|
|
|
Borrowings and overdrafts |
(150.0) |
150.0 |
- |
- |
|
Lease liabilities |
(156.6) |
108.9 |
(112.7) |
(160.4) |
|
Derivative financial instruments |
(8.4) |
1.2 |
2.7 |
(4.5) |
|
|
(315.0) |
260.1 |
(110.0) |
(164.9) |
|
Non-current liabilities |
|
|
|
|
|
Borrowings |
(650.0) |
- |
|
(650.0) |
|
Unamortised bond transaction costs |
7.4 |
- |
(0.8) |
6.6 |
|
Fair value adjustment for hedged element on bonds |
1.0 |
- |
2.7 |
3.7 |
|
Lease liabilities |
(1,831.7) |
- |
52.8 |
(1,778.9) |
|
Derivative financial instruments |
(0.8) |
- |
(3.3) |
(4.1) |
|
|
(2,474.1) |
- |
51.4 |
(2,422.7) |
|
Total net debt |
(1,270.7) |
(200.3) |
(30.9) |
(1,501.9) |
During the period ended 30 July 2022, two term loans totaling £150m were repaid.
|
Reconciliation of net cash flow to net debt |
|
|
|
|
|
26 weeks to 30 July 2022 |
26 weeks to 31 July 2021 |
52 weeks to 29 January 2022 |
|
|
£m |
£m |
£m |
|
(Decrease)/increase in net cash and cash equivalents in the period |
(470.8) |
(485.4) |
(102.8) |
|
Cash outflow/(inflow) from movement in short-term investments |
150.0 |
391.5 |
75.0 |
|
Cash outflow/(inflow) from borrowing |
15.0 |
75.0 |
95.0 |
|
Cash outflow from movement in other net debt items |
105.5 |
137.5 |
274.1 |
|
Cash movement in net debt for the period |
(200.3) |
118.6 |
341.3 |
|
Opening net debt |
(1,270.7) |
(1,405.5) |
(1,405.5) |
|
Non-cash movements in net debt for the period |
(30.9) |
(113.2) |
(206.5) |
|
Closing net debt |
(1,501.9) |
(1,400.1) |
(1,270.7) |
|
|
|
|
|
|
|
|
|
|
The principal financial risks to which the Group is exposed are capital and long-term funding risk, liquidity risk, interest rate risk, foreign currency risk, credit risk, and energy risk.
This condensed set of interim financial statements does not include all risk management information and disclosures required in the annual financial statements and should be read in conjunction with the Annual Report and Accounts for the 52 weeks to 29 January 2022. During the 26 weeks to 30 July 2022, the Group has continued to apply the financial risk management process and policies as detailed in the Annual Report and Accounts for the 52 weeks to 29 January 2022.
Valuation techniques and assumptions applied in determining the fair value of each class of asset or liability are consistent with those used as at 29 January 2022 and reflect the current economic environment.
Fair value estimation
The different levels per the IFRS 13 fair value hierarchy have been defined as follows:
Level 1: Quoted prices (unadjusted) in active markets for identical assets or liabilities
Level 2: Inputs other than quoted prices included within Level 1 that are observable for the asset or liability, either directly (that is, as prices) or indirectly (that is, derived from prices)
Level 3: Inputs for the asset or liability that are not based on observable market data (that is, unobservable inputs)
During the 26 weeks to 30 July 2022, there have been no transfers between any levels of the IFRS 13 fair value hierarchy and there were no reclassifications of financial assets as a result of a change in the purpose or use of those assets.
The fair value of a derivative financial instrument represents the difference between the value of the outstanding contracts at their contracted rates and a valuation calculated using the forward rates of exchange and interest rates prevailing at the balance sheet date. The fair value of the derivative financial instruments held by the Group are classified as Level 2 under the IFRS 13 fair value hierarchy, as all significant inputs to the valuation model used are based on observable market data and are not traded in an active market. At 30 July 2022, the net fair value of derivative financial instruments was £22.2m, liability (29 January 2022: £1.5m, liability; 31 July 2021: £14.6m, liability).
The following table compares the Group's liabilities held at amortised cost, where there is a difference between carrying value (CV) and fair value (FV):
|
|
30 July 2022 |
31 July 2021 |
29 January 2022 |
|||
|
|
£m |
£m |
£m |
£m |
£m |
£m |
|
|
CV |
FV |
CV |
FV |
CV |
FV |
|
Financial liabilities |
|
|
|
|
|
|
|
Listed bonds |
(593.4) |
(542.4) |
(592.0) |
(659.8) |
(592.6) |
(619.5) |
The fair values of the Group's listed bonds have been determined by reference to market price quotations and classified as Level 1 under the IFRS 13 fair value hierarchy. For other financial assets and liabilities, there are no material differences between carrying value and fair value.
At 30 July 2022, contracts had been entered into for future capital expenditure of £64.7m (29 January 2022: £23.3m; 31 July 2021: £49.2m) of which £51.8m (29 January 2022: £20.8m; 31 July 2021: £44.1m) relates to property, plant and equipment and £12.9m (29 January 2022: £2.5m; 31 July 2021: £5.1m) relates to intangible assets.
There have been no material changes to the principal subsidiaries listed in the Annual Report and Accounts for the 52 weeks to 29 January 2022. All related party transactions arise during the ordinary course of business. There were no material changes in the transactions or balances during the 26 weeks to 30 July 2022.
There are no disclosable subsequent events.
The Directors confirm that to the best of their knowledge the condensed set of interim financial statements has been prepared in accordance with UK-adopted IAS 34 Interim Financial Reporting.
There have been no changes to the directors of John Lewis plc to those listed in the financial statements for the year ended 29 January 2022.
For and by order of the Board
Sharon White and Bérangère Michel
Directors, John Lewis plc
14 September 2022
[1] Loss before tax
[2] All references to sales are Total trading sales which includes VAT, sale or return and other non-cash accounting adjustments
[3] We report sales using two measures: in total and like-for-like. 'In total' is the comparison between the statutory balances for two periods of time (e.g. this year to last year). 'Like-for-like' sales are the 'in total' sales after adjustments to remove the impact of shop openings and closures. Waitrose like-for-like sales excludes fuel. Like-for-like sales gives a better comparison of our underlying performance
[4] Source: Kantar, 28 weeks to 7 August 2022